We use cookies to provide you with an optimal website experience. This includes cookies that are necessary for the operation of the site and cookies that are used for statistical purposes and for marketing purposes or to display personalized content. For more information, please see our privacy policy. ![]()
Essentials
These cookies are absolutely necessary for the operation of the site.
Statistics
We use statistics cookies to collect anonymous data for statistics and analysis.
Marketing
We use marketing cookies to adjust the contents of the website to your needs.


Noise
Sensitivity
Linewidth
Range
Noise
Frequency Range
Linewidth
Reduction
RIN
Limit
The LWA-1k features a superb sensitivity allowing the analysis of lasers with very narrow linewidths down to 1 kHz. Intrinsic linewidth can even be resolved down to 350 Hz.
Additionally, the signal generated by the 1k models can be used in combination with a fast feedback controller to actively reduce the laser frequency noise.
An intuitivly usable and responsive GUI provides the user with noise density and lineshape plots as well as the significant linewidth values.
ECDL @1550 nm free running:
Effective (β-separation) 946.0 kHz; Intrinsic 53.2 kHz
ECDL @1550 nm locked to LWA-1k:
Effective (β-separation) 90.5 kHz; Intrinsic 110.6 kHz
Fiber laser @1550 nm: Effective (β-separation) 2.1 kHz; Intrinsic 0.3 kHz
ECDL @1550 nm free running: Linewidth 830.8 kHz
ECDL @1550 nm locked to LWA-1k: Linewidth 45.5 kHz
Fiber laser @1550 nm: Linewidth 5.5 kHz

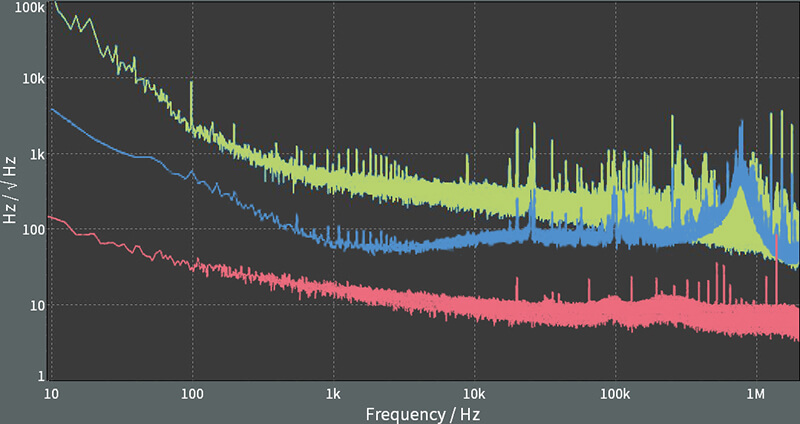
A Fourier analysis of recorded time-domain laser frequency deviation signals yields a frequency noise density plot in the frequency domain (blue line) with 1/f-noise, characteristic noise peaks and a white noise floor.
According to the β-separation method 1), the effective linewidth is proportional to the area of the frequency noise (blue) above the β-separation line (red line). The intrinsic linewidth is given by the noise floor level (in Hz2/Hz) times π (rule of thumb).
1) Di Domenico, et al., Applied Optics 49, issue 25, 4801 – 4807, 2010
Don't hesitate to contact our service team for user defined functions or OEM applications. We are always open for customers requirements.